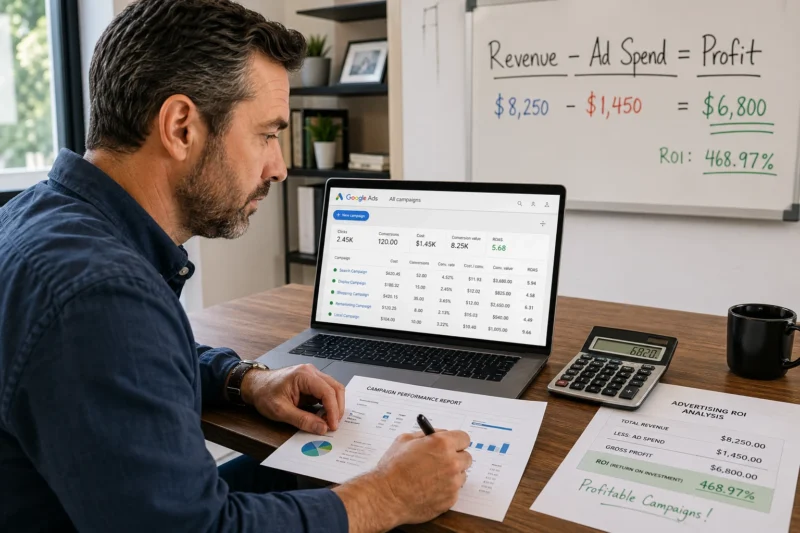
If Google Ads brings you more sales, it means your campaigns generate more profit than they cost to run. It sounds simple, but the numbers often tell a different story.
Most businesses look at their Google Ads dashboard and see numbers and graphs without understanding what they mean. They might see 500 clicks in a month and assume things are working, even though those clicks cost $2,000 and only brought in $800 in sales.
This gap occurs because many businesses focus on surface-level metrics rather than those that show true performance. But once you understand conversion tracking properly, you’ll catch problems before they drain your budget.
This guide shows you the exact metrics successful advertisers watch daily. You’ll also learn how to read your numbers and make wiser decisions about your ad spend. Let’s dig in.
Understanding Google Ads ROI Metrics That Drive Profit
Tracking ROI metrics will help you spot losing campaigns before they waste your budget.
So if you’ve ever stared at your Google Ads dashboard wondering whether you’re actually making money, we can tell you that it’s a common concern. Many advertisers focus on clicks and impressions without checking if those numbers bring actual revenue. As a result, campaigns may appear active but fail to generate profit.
Here are the basic metrics that reveal profit:
Cost Per Acquisition vs. Customer Lifetime Value

Your customer acquisition cost shows exactly what you spend to gain one customer through your ad campaigns. For instance, a Sydney plumber might spend $45 per lead, but only 30% of those leads book a job.
Meanwhile, customer lifetime value tells you the total revenue one customer generates over time. In practical terms, spending $80 to acquire a customer who brings in $500 over two years makes perfect sense. But spending $80 for a one-time $50 sale doesn’t (and yes, we’ve seen Brisbane retailers burn through budgets acquiring customers who only buy once).
So when you compare both numbers, you’ll know instantly if your ad spend creates profit or just creates activity.
How Conversion Tracking Reveals Campaign Performance
Most ad dashboards show clicks, but they don’t show what those clicks really lead to. Conversion tracking setup, on the other hand, connects your ad clicks to actual sales completions. Without this, you’re guessing.
Here’s how it works. Someone clicks your ad, lands on your site, and fills out a contact form three days later. In the meantime, tracking conversions across multiple platforms captures that journey and shows you which ad campaigns drove the result. Conversion data becomes valuable here since it reveals which campaigns drive revenue instead of just traffic.
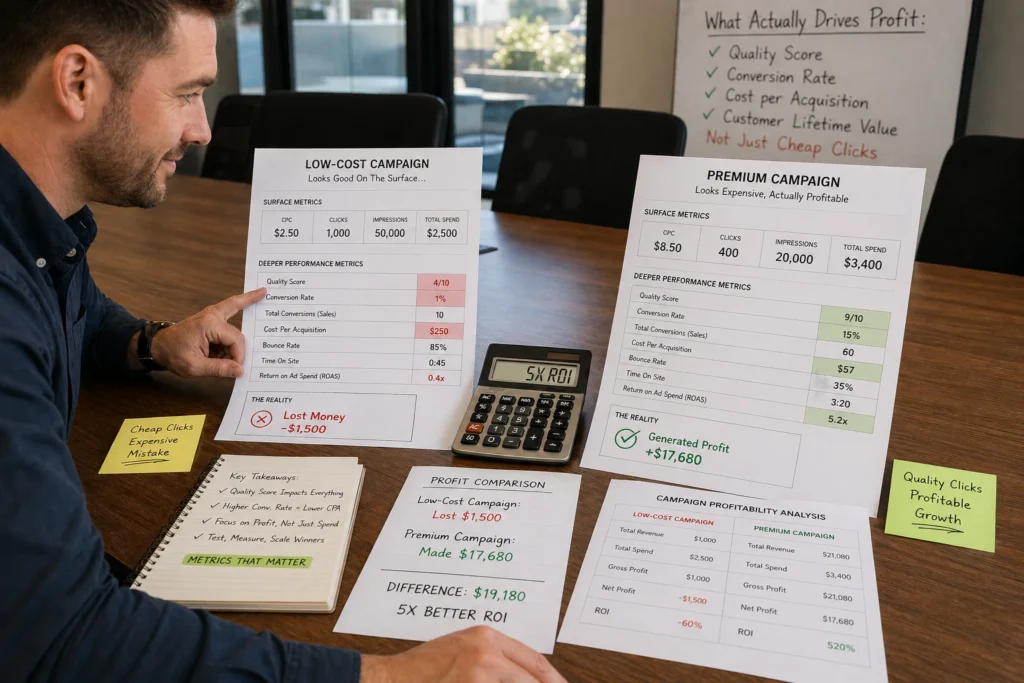
We worked with a Melbourne trades business that discovered their “cheap clicks” campaign converted at 2%, while a higher-cost campaign reached 12%. This means the cheaper clicks were costing them more per job.
Ad Spend Alone Doesn’t Tell the Full Story
You might be spending more and getting more clicks, but if those clicks do not convert into paying customers, the campaign is not profitable.
Generally, campaign performance depends on how well your advertising efforts align with your business goals. That’s why spending $3,000 per month may seem expensive, but if it brings in $15,000 in jobs, the return justifies the cost. This means revenue generated per dollar spent counts more than the size of the budget.
Across the Google Ads campaigns we manage, the most successful businesses track profit per campaign rather than cost per click. Because of this, they know exactly how much revenue each dollar generates.
Reading Your Ad Campaign Numbers Without the Guesswork

Many advertisers look at their dashboard and have no idea if they’re winning or losing. That confusion usually comes from not knowing which numbers are important for performance measurement.
However, once you focus on the right ROI metrics, it becomes much easier to read what your campaigns are telling you. For instance, a 2% CTR might sound low, but in competitive industries like legal services in Melbourne, that’s actually a solid result.
From there, your dashboard starts to make more sense as you can spot patterns in how your campaigns perform day to day. For example, if your Monday traffic converts at 8% but your Friday traffic sits at 2%, it’s useful in making informed decisions about budget allocation.
Now, a common problem is that many business owners only check their ad account once or twice a month, then panic when the credit card bill arrives. To prevent this, the better approach is to check your key metrics weekly and adjust based on what the data truly shows.
In practice, weekly checking means looking at your ad campaigns through three lenses: cost, conversions, and revenue. When all three align, you know you’re on track.
Attribution Models: Connecting Clicks to Actual Sales
Attribution models generally show you which touchpoints deserve credit for your sales.
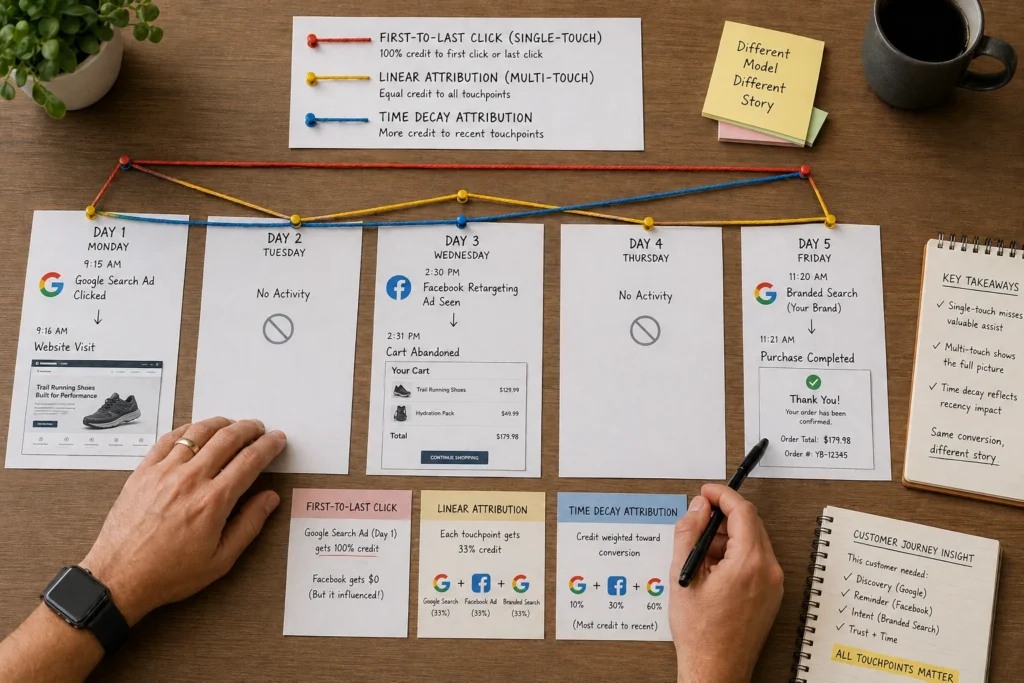
For example, a customer might click your Google Ads campaign on Monday, see your Facebook ad on Wednesday, then search your brand name on Friday before converting. At that point, the question becomes clear: which platform deserves the credit for the conversions?
That answer depends entirely on the attribution model you use, because each one assigns value differently across the journey.
Now, let’s have a look at different attribution models:
First-Click vs. Last-Click Attribution
First-click attribution gives full credit to the channel that starts the customer journey, so your Google Ads campaign gets the conversion. In contrast, last-click attribution assigns all credit to the final interaction, which means your brand search ad claims the conversion.
While both models are simple to understand, they overlook everything that happens in between, including the touchpoints that influence a customer before they make a decision. In most cases, multiple attribution models reveal how different marketing channels work together.
Multi-Touch Attribution for Ad Platforms
To understand the full impact of your campaigns, you need to look beyond a single touchpoint. Multi-touch attribution often tracks customer behaviour across your entire sales cycle and spreads credit based on each interaction’s role.
Once this data is collected, attribution reports show which ad platforms deserve recognition at different stages. Sometimes, your awareness campaigns might start customer journeys while paid search ads close them. Either way, both contribute to ad performance.
Beyond these basics, advanced attribution models reveal patterns in complex customer journeys. In other words, the sales cycle for a $50 product looks completely different from a $5,000 service. And your attribution data should reflect that reality.
Advanced Metrics That Separate Profitable Ads from Money Pits
Basic metrics tell you what happened, but advanced metrics tell you why it happened. This difference becomes clearer when you look at actual campaign performance.
Look at this scenario: Your clicks stay steady, your cost per click cpc looks reasonable, and traffic keeps flowing. Yet the leads coming through aren’t converting into actual jobs or sales. In this situation, advanced metrics show you what’s missing.
Check out the most significant metrics that are worth tracking:
- Quality Score: This metric rates ad relevance and landing page experience per keyword on a 1–10 scale. Sometimes, improving from 5 to 8 can cut your cost per acquisition by 30% (we’ve seen it happen dozens of times).
- Search Impression Share: With this metric, you can see how often your ads appear in auctions compared to possible opportunities. For instance, at 60%, you’re missing 40% of chances because your budget runs out early or your ad rank can’t compete.
- Ad Group Performance: Looking at performance at the keyword level shows which terms bring qualified leads versus just traffic. In practice, one keyword costs $2 per click at a 1% conversion rate, while another costs $8 but converts at 15%. This means the higher-cost keyword produces leads more efficiently (and saves you money in the long run).
- Display Ad Metrics: Unlike paid search, display campaigns require a different approach. That’s why you should focus on reach and how visibility influences branded search demand over time.
- Conversion Value Metrics: A reliable indicator of which campaigns drive profit and which ones underperform. Once, a Melbourne contractor ran three campaigns where the lowest Cost-Per-Click had the worst conversion rate. Meanwhile, the higher-cost clicks delivered better leads at half the price.
These metrics show you where to invest your budget and how it performs over time. However, not all metrics are created equal, so you should focus on the ones that link directly to revenue.
Getting Real Results from Your Google Ads Investment
Once you understand the mentioned metrics, your approach to Google Ads will start to change. Instead of guessing whether your ad campaigns are working, you’ll know exactly which ones create profit and which ones waste money.
Ready to improve campaign performance? Start by checking your Google Analytics setup and making sure your conversion tracking captures real sales.
Later, if you need help setting up proper tracking or optimising your existing campaigns, contact KC Freedom. We specialise in Google Ads management that focuses on ROI instead of vanity metrics.